This Special Event web page is intended to provide direct links to and images of data and materials available from SAGE programs and preliminary research results from the seismology community. We welcome any additional contributions containing original content that might be of interest to the research community. Please send them to the email address listed below.
SAGE does not necessarily endorse the views or scientific validity of the posted items.
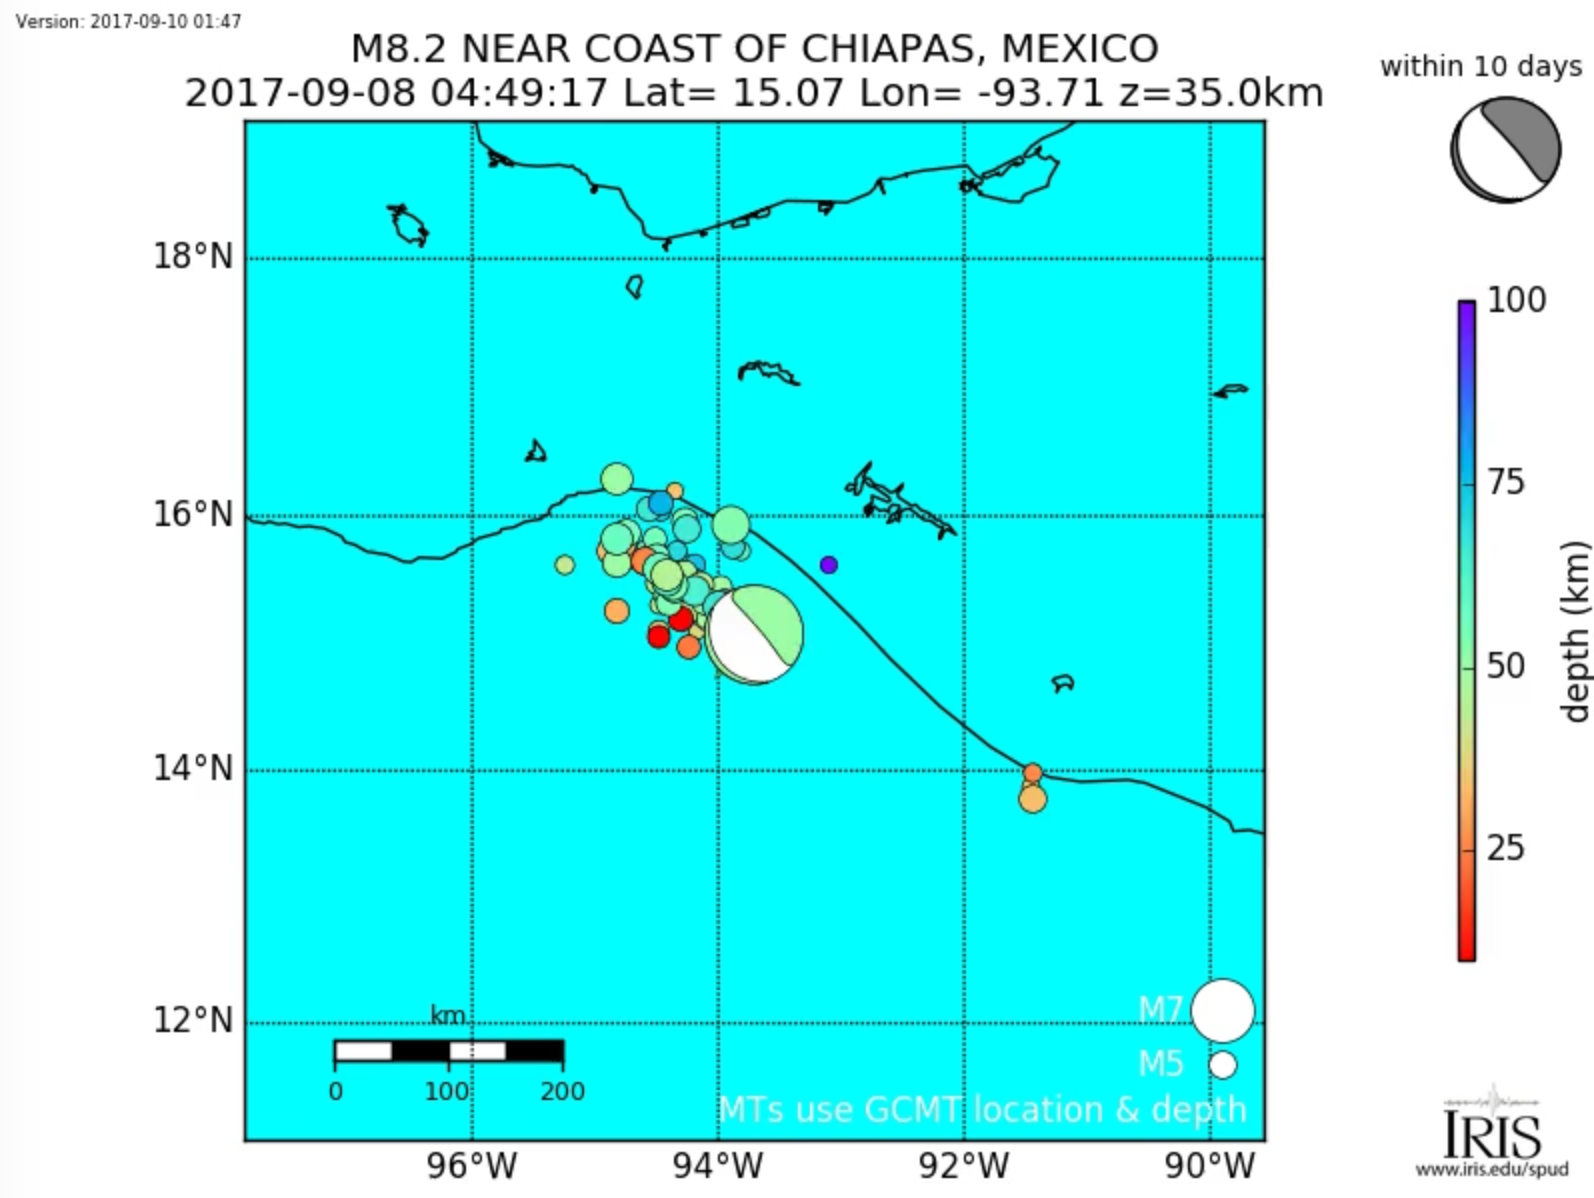
September 8, 2017 M8.1 near coast of Chiapas, Mexico earthquake
Email contributions to:
special-events@lists.ds.iris.edu
Note:
All scientific contributions addressed to the community will be forwarded to the special-events mailing list.
If you DO NOT want your email being forwarded, please address it to SAGE or explicitly write
do not forward.
Quick Links
Email contributions to: 
special-events@lists.ds.iris.edu
Event parameters (from USGS) 
These are preliminary results and are subject to change without notice. Please check the USGS page for the latest official information.
| Magnitude | 8.1 |
|---|---|
| UTC Time | Friday September 8, 2017 at 04:49:21 UTC |
| Location | 15.068°N, 93.715°W |
| Depth | 69.7 km |
| Region | near coast of Chiapas, Mexico |
| Distance | 87km SW of Pijijiapan, Mexico |
| Details | USGS |
Links 
Figures 
[USGS Event KML] USGS ShakeMap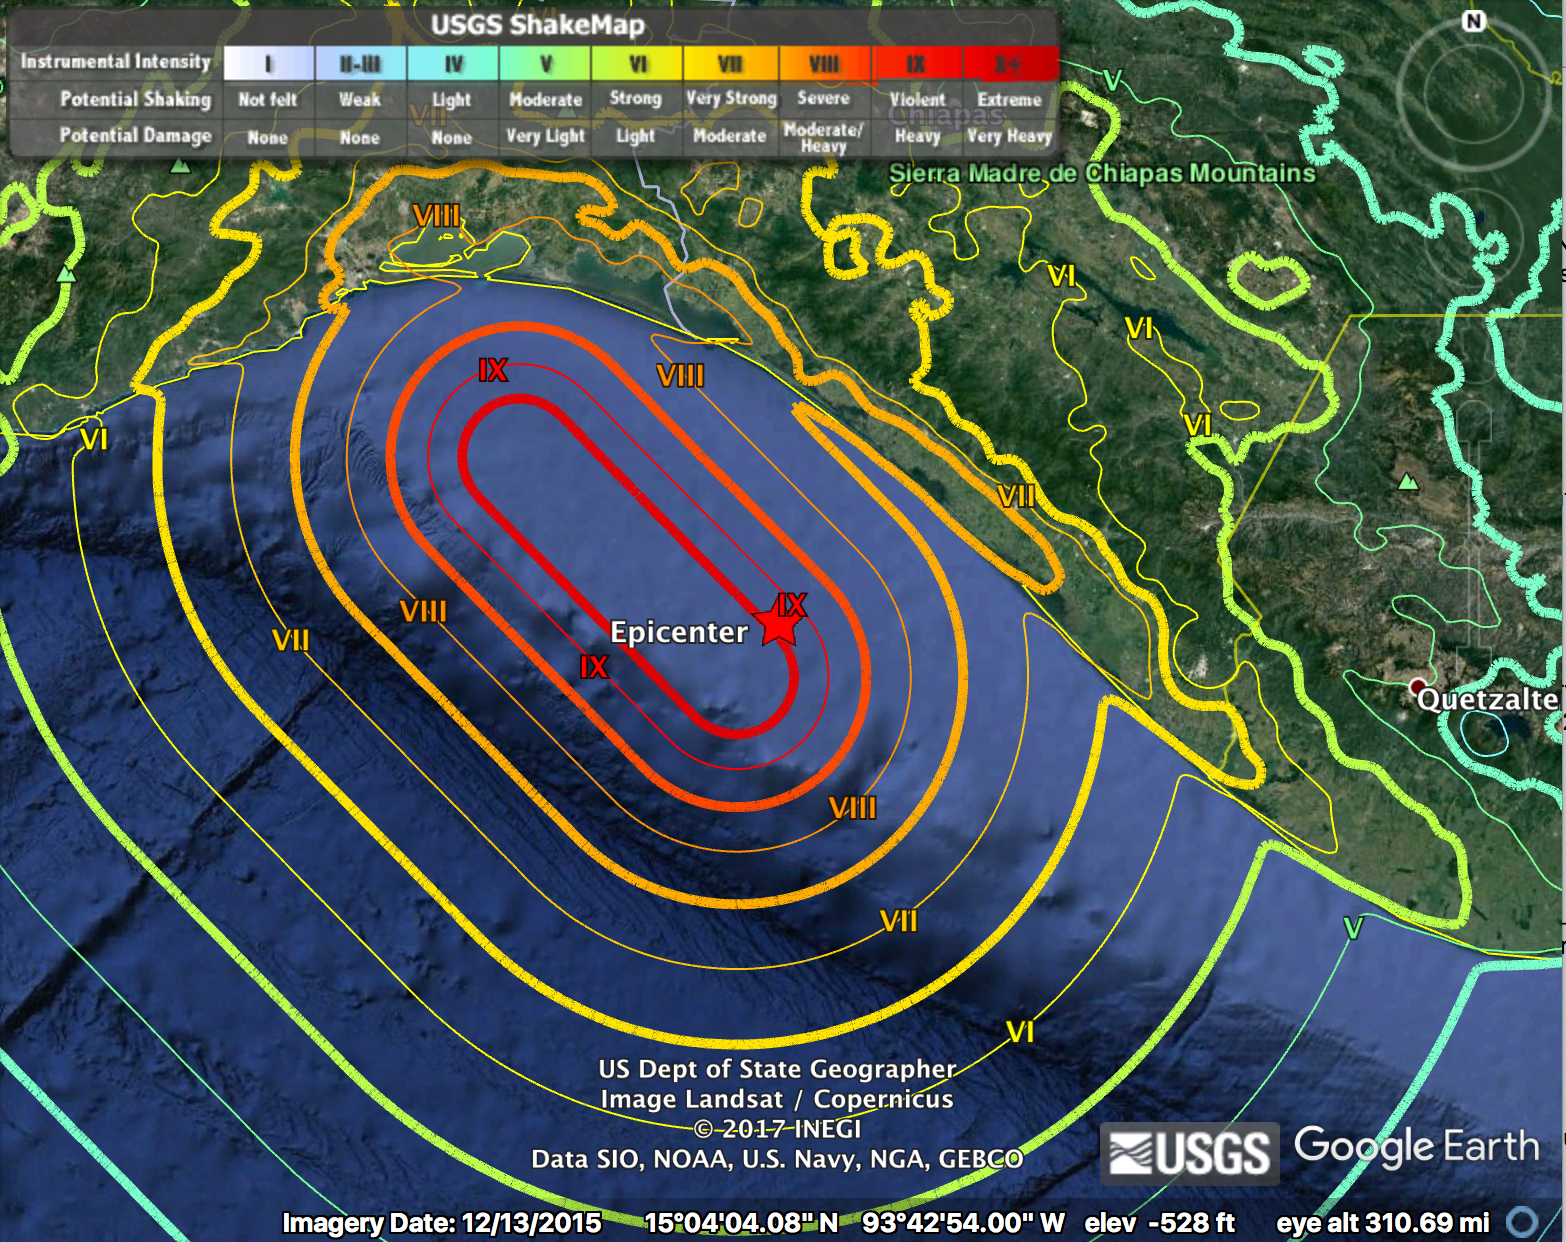
[Robert Anthony, USGS] Ground acceleration spectrogram for the vertical component of SDDR 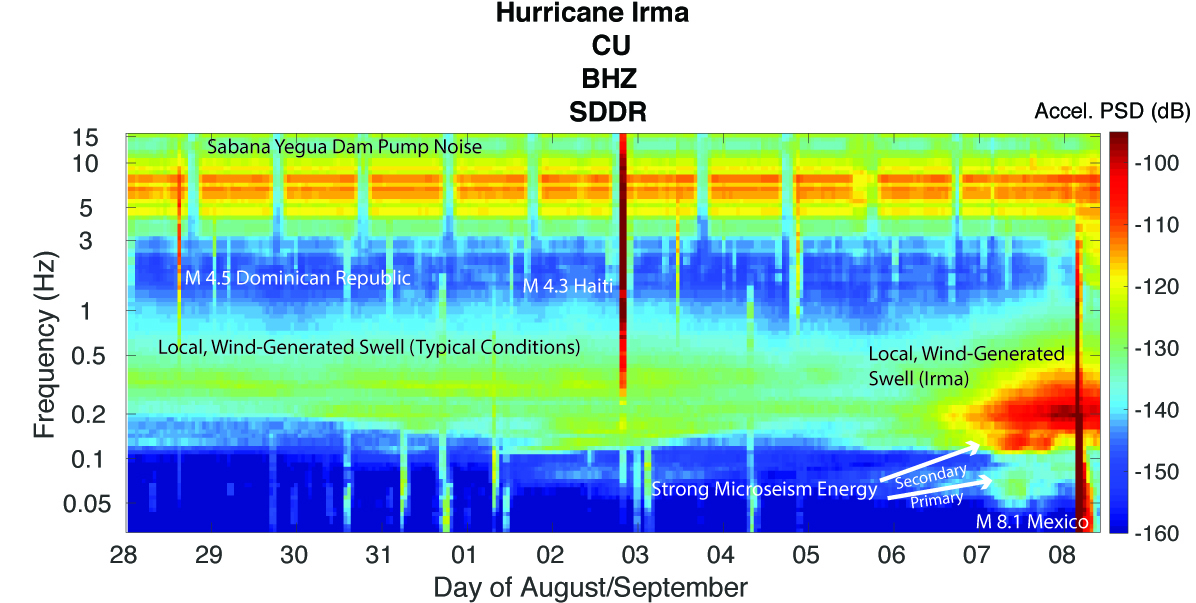
(Presa de Sabenta, Dominican Republic) from 28 August to 8 September 2017 (UTC). Power
Spectral Density (PSD; rel. 1 (m/s2)2/Hz) estimates were attained using the IRIS Noise Tool Kit
(NTK) using 2-hour windows with 50% overlap and 1/16th octave smoothing. The M 8.1 Mexico
earthquake along with a local (~100 km) M 4.3 event in Haiti, and a 4.5 in the northeast
Dominican Republic are noted. Two additional earthquakes (~M 4) located to the east of the
Dominican Republic can be seen as transient increases in power between ~1-5 Hz. Station
SDDR is located ~100 m from Sabana Yegua Dam and pump noise is quite prevalent at this
station. It appears the dam pumps are running continuously as Hurricane Irma passes the
Dominican Republic, likely in response to increased runoff into the reservoir.
[GEOSCOPE Observatory] Automatic determination of source parameters 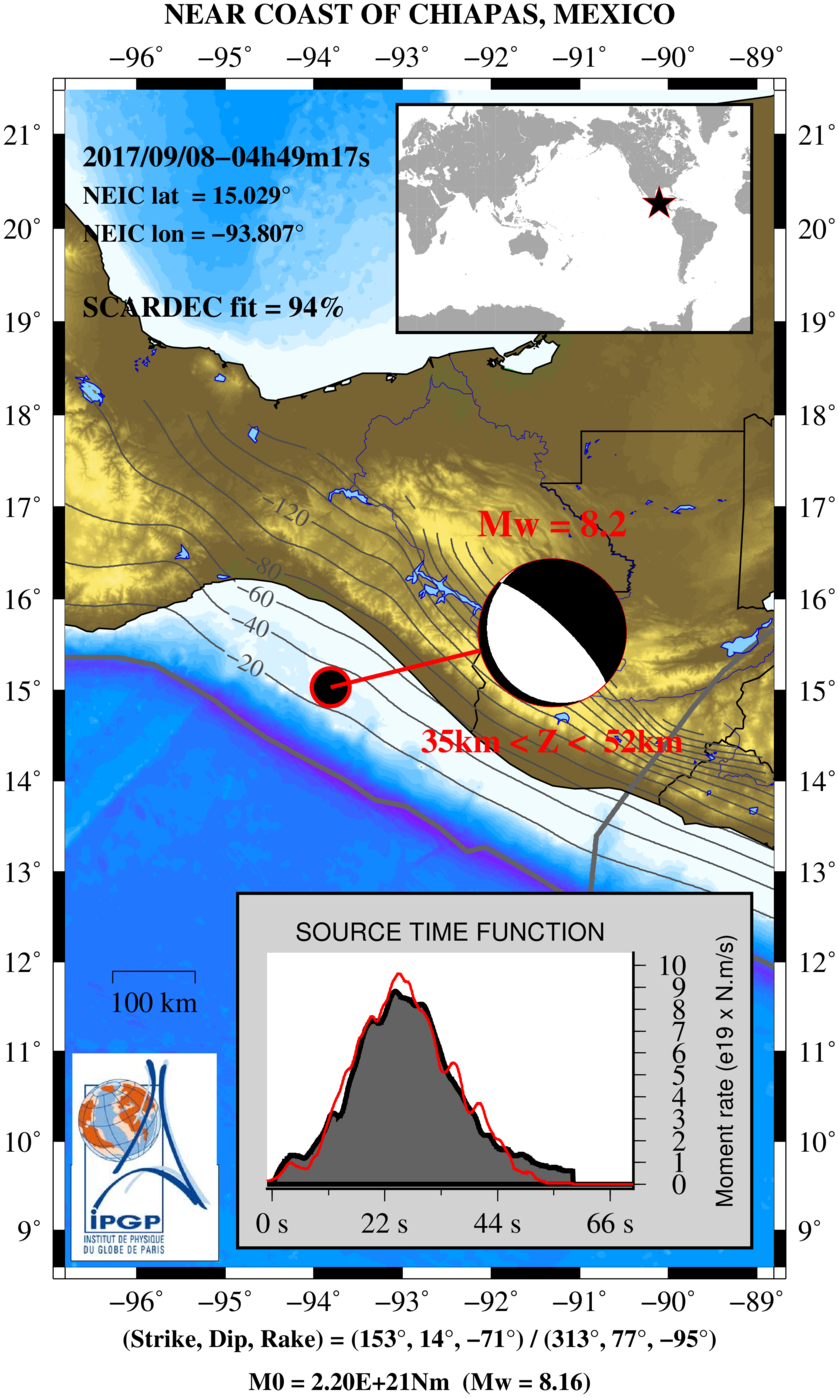
using the SCARDEC method
[Afroz Shah, Universiti Brunei Darussalam] interpretation of event based on its fault plane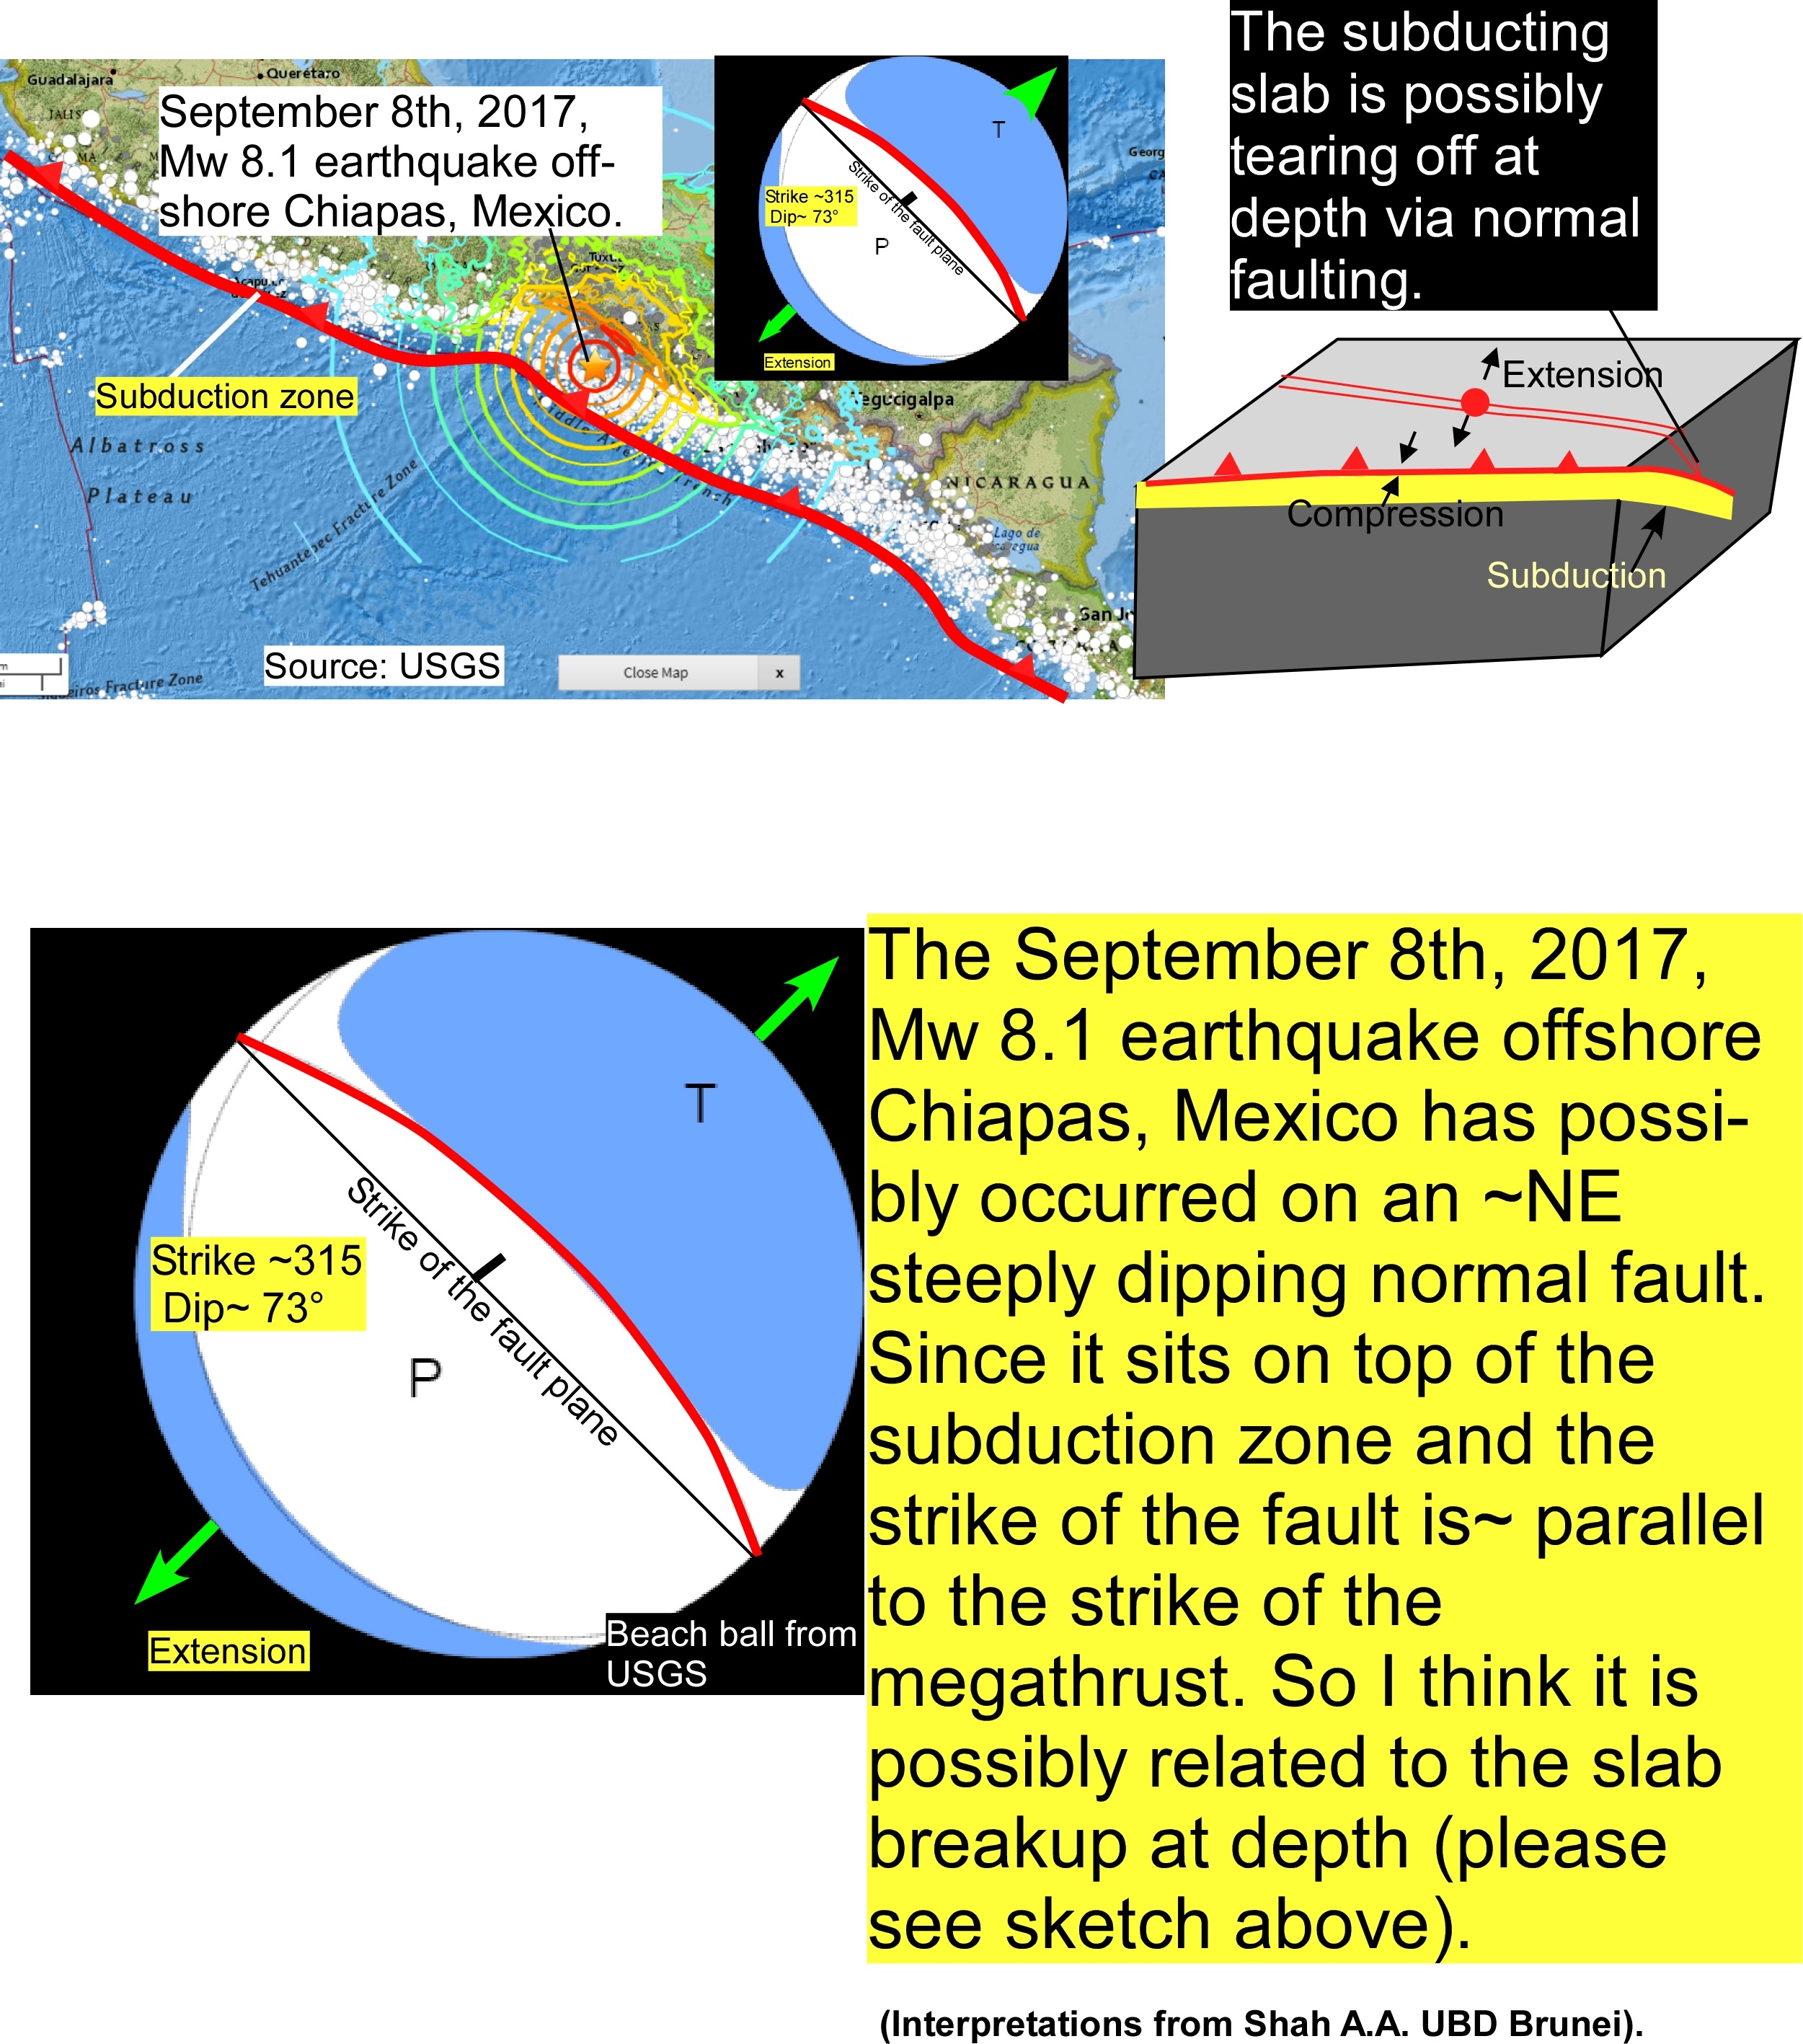
solution and the regional tectonics.
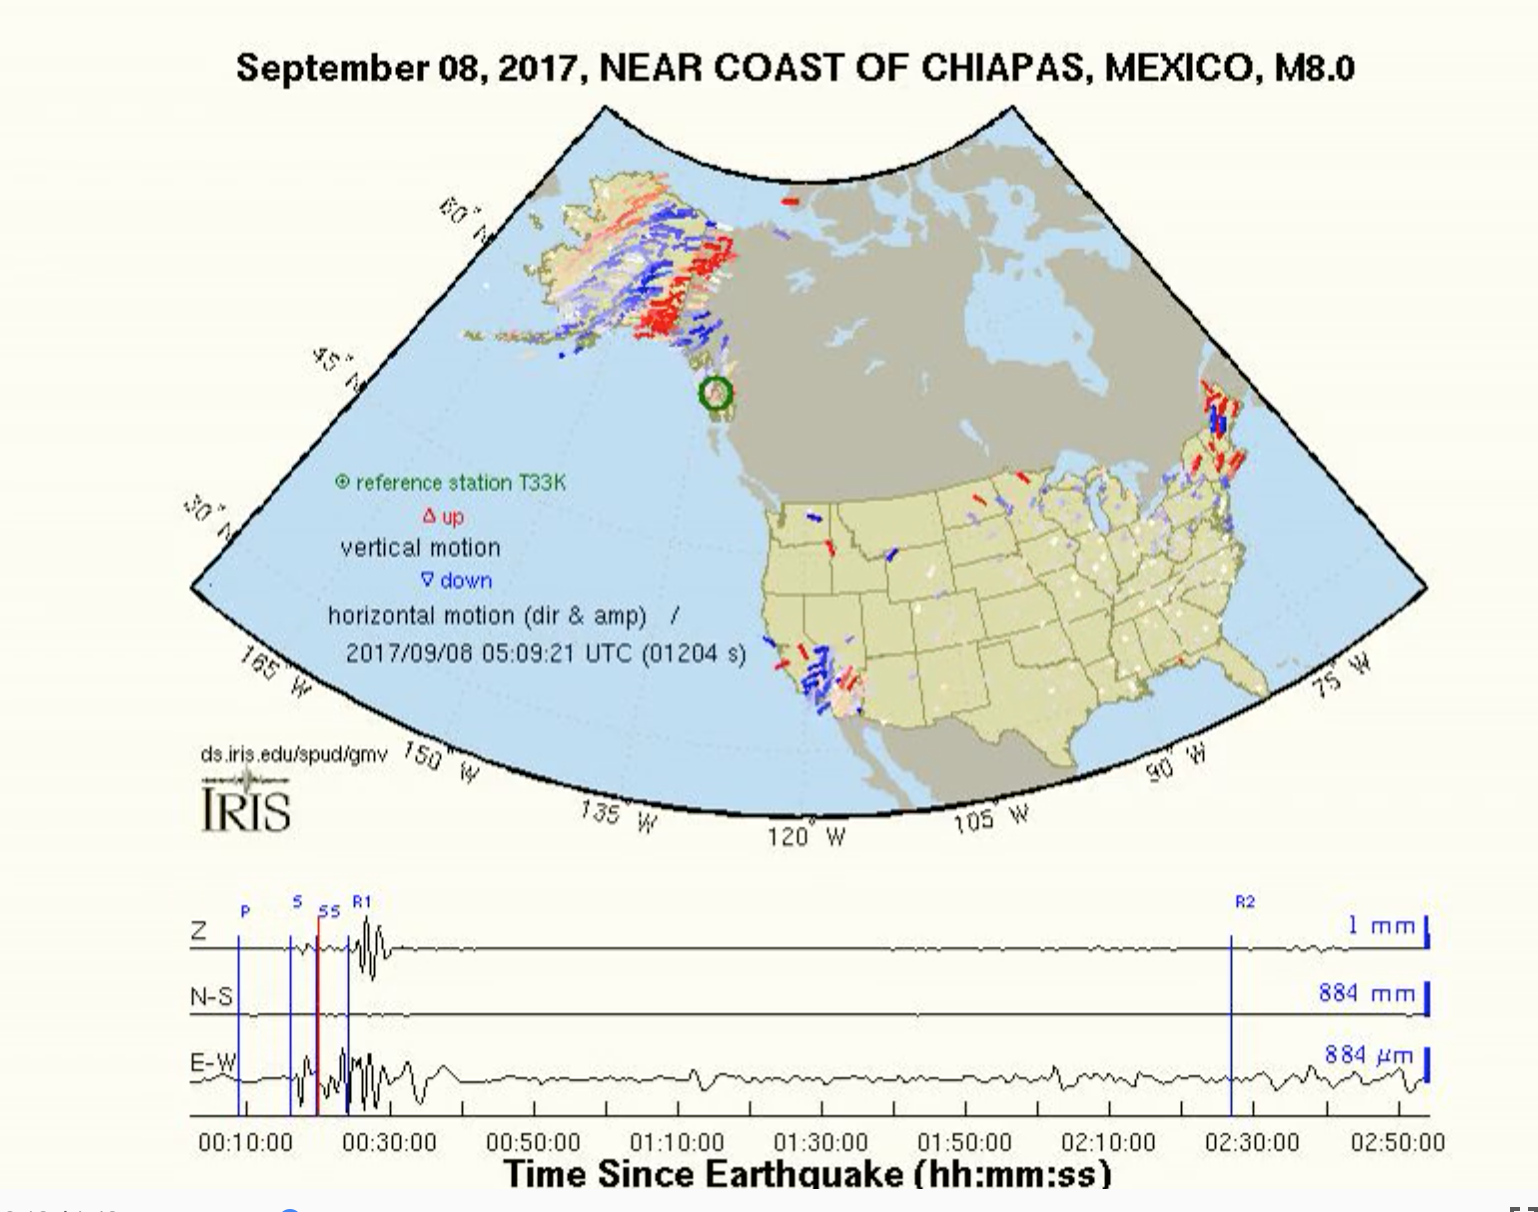
[IRIS DMC Event Plots Product] Combined and aligned on origin 0.3 to 1.0 Hz BHZ 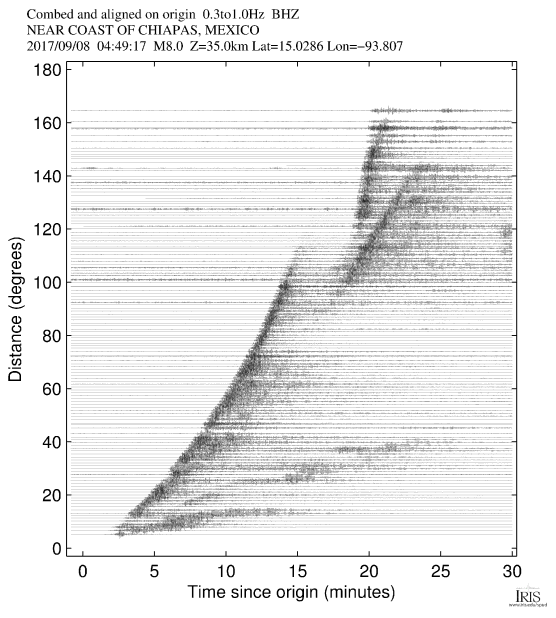
(click on image to access the EventPlots for Mww 8.0 NEAR COAST OF CHIAPAS, MEXICO).
Videos & Animations 
Miscellaneous Contributions 
[K. McLaughlin, Alexandria, VA] A Raspberryshake plot of the recording from my basement 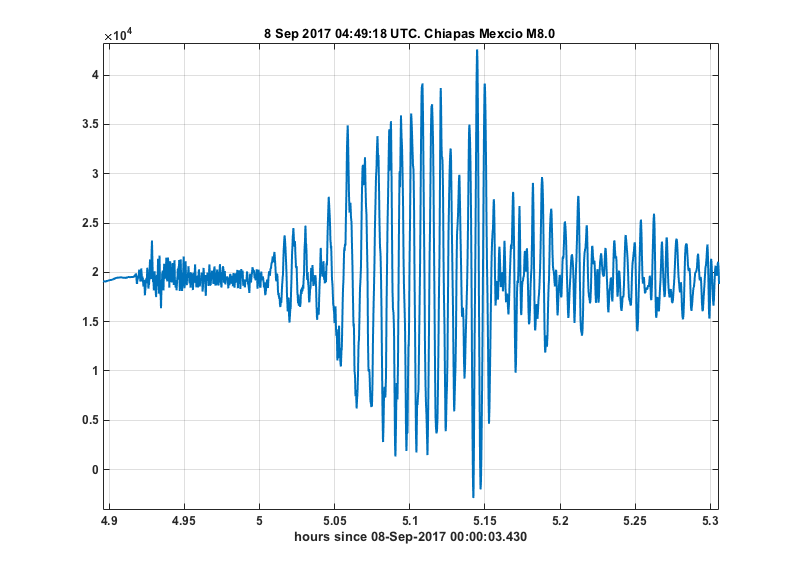
corrected to a BB 0.01-2 Hz seismogram. Not bad for a 4.5 Hz geophone. It was an M8
after all.
[Gerald Payton, North Central Texas] Seismogram reading of Grandview, Texas station.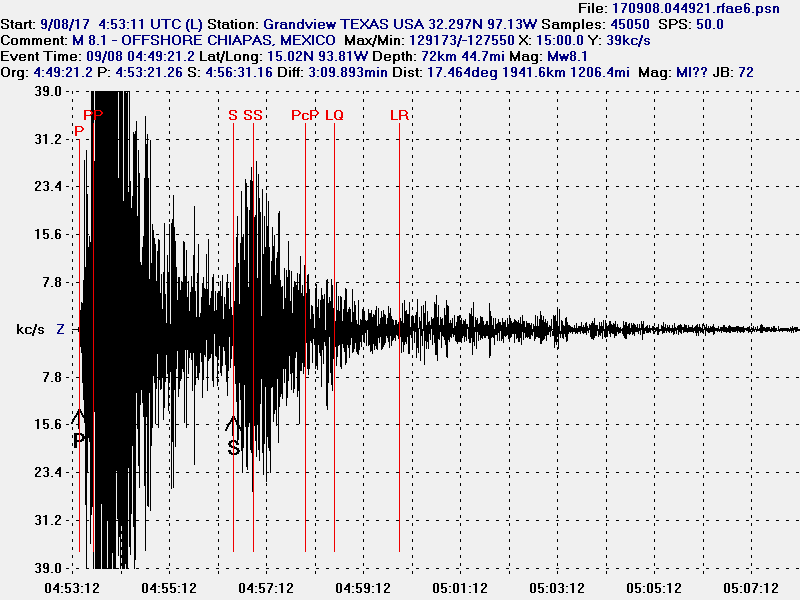
SAGE Facility Event Page
The SAGE Facility event page for this event contains links to additional tools and data.
Related Content
These other pages were tagged similarly:
- Stations recording data during a specific event [FAQ]
- Gulf of Alaska [Special Event: 2018-01-23]
- Hawaii [Special Event: 2018-05-04]
- Where can I find information on recent earthquakes? [FAQ]
- Seismic Event Data [Web page]
- Special Seismic Events [Topic]
- How do I interpret magnitudes and magnitude types? [FAQ]
- Seismic event sources: earthquakes vs. fracking [FAQ]
- EMC-CAP22 [Product]


