Summary
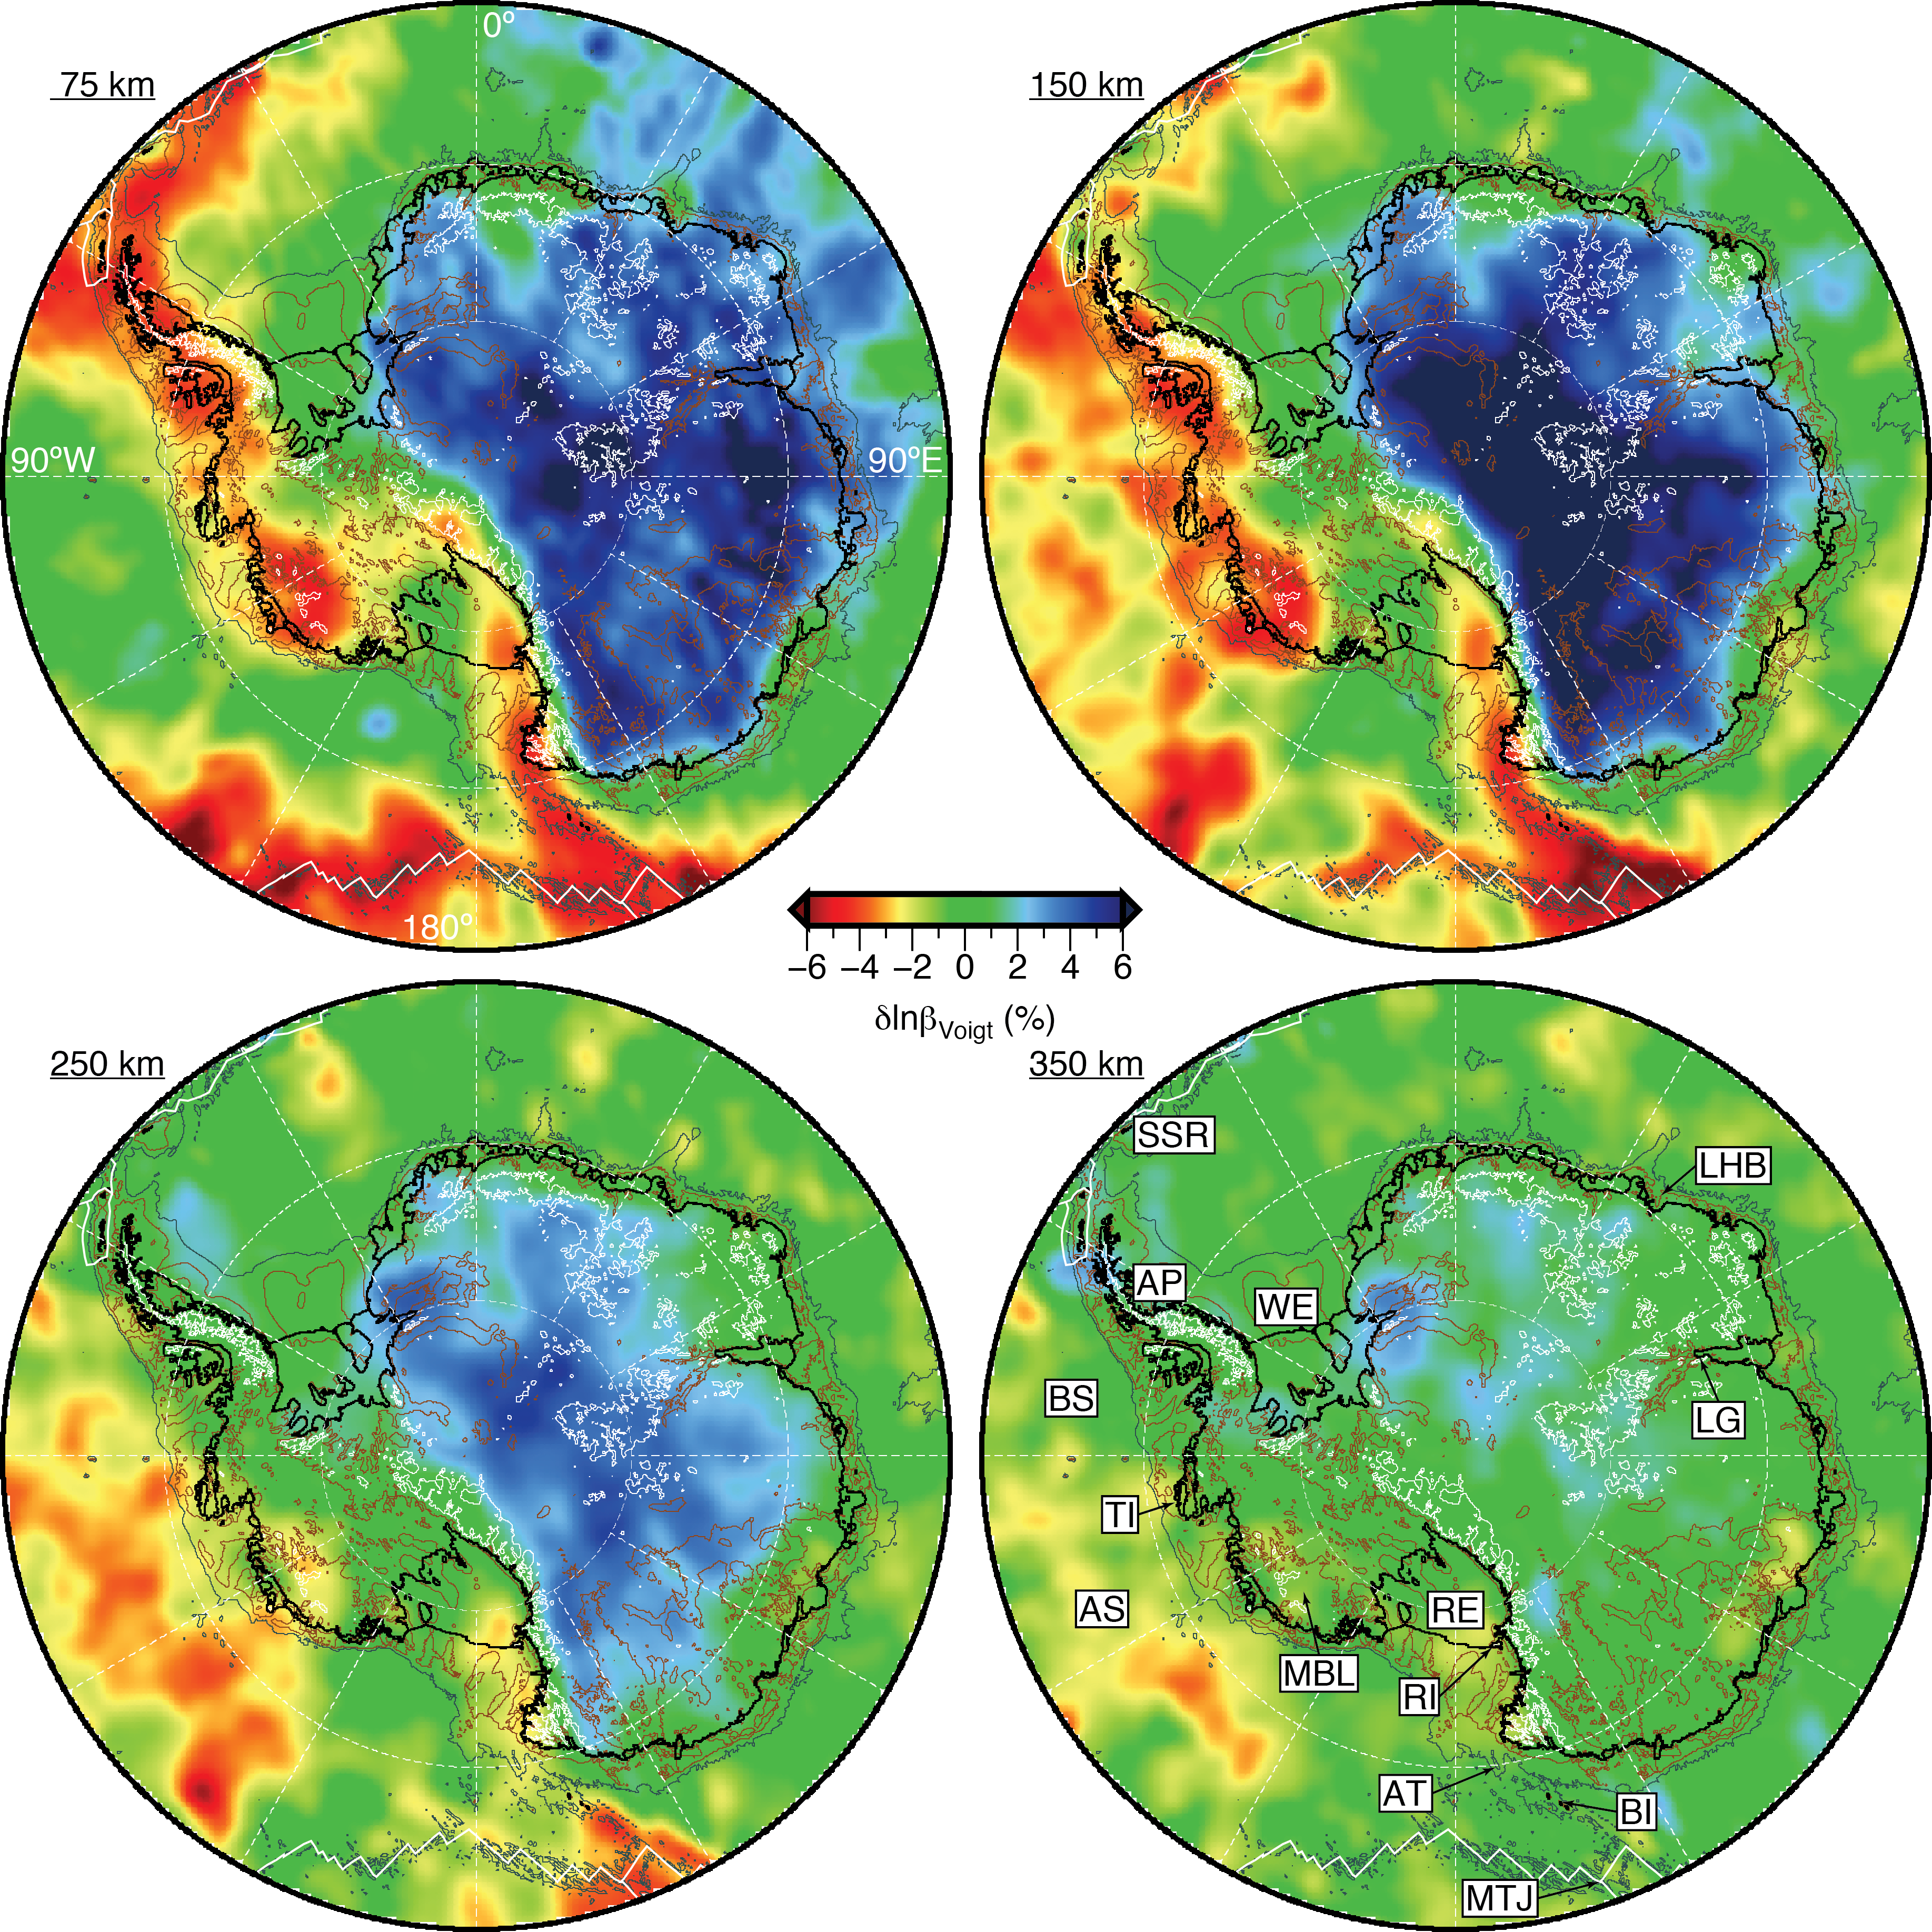
ANT-20 is a 3D tomographic model of the upper mantle and transition zone structure beneath Antarctica and the surrounding southern oceans.
Quicklinks
Description
| Name | ANT-20 |
| Title | Voigt average shear wave speed structure of Antarctica and the surrounding southern oceans |
| Type | 3-D Tomography Earth Model |
| Sub Type | Shear wave speed (km/s) |
| Year | 2020 |
| Data Revision | r.0.0 (revision history) |
| Short Description | ANT-20 is a 3D tomographic model of the upper mantle and transition zone structure beneath Antarctica and the surrounding southern oceans. The tomographic model is constructed using the adjoint methods and the computational package SPECFEM3D_GLOBE. Here the Voigt average shear wave speeds obtained from 20 iterations of the inversion are provided. A more detailed description of the model is provided in Lloyd et al. (2020) |
| Usage Notes | These models are reported in Antarctic Polar Stereographic projection with latitude of true scale at -71 degrees south; the origin (0,0) km at South Pole; Positive Y-axis along 0 degree longitude; Positive X-axis along 90 degree East longitude. See ANT-20-voigtVs-0.0.nc metadata for projection parameters. |
| Authors: | Andrew J. Lloyd: Lamont-Doherty Earth Observatory, Columbia University, Palisades NY Douglas A. Wiens: Department of Earth and Planetary Sciences, Washington University, St. Louis, MO, Hejun Zhu: Department of Geosciences, The University of Texas at Dallas, Richardson, TX Jeroen Tromp: Department of Geosciences and Program in Applied and Computational Mathematics, Princeton University, Princeton, NJ, Andrew A. Nyblade: Department of Geosciences, Pennsylvania State University, PA Richard C. Aster: Department of Geosciences, Colorado State University, Fort Collins, CO, Samantha E. Hansen: Department of Geological Sciences, The University of Alabama, Tuscaloosa, AL Ian W. D. Dalziel: Institute for Geophysics, Jackson School of Geosciences, The University of Texas at Austin, Austin, TX Terry J. Wilson: Byrd Polar Research Center and School of Earth Sciences, The Ohio State University, Columbus, OH Erik R. Ivins: Jet Propulsion Laboratory, California Institute of Technology, Pasadena, CA John Paul O’Donnell: School of Earth and Environment, The University of Leeds, Leeds, UK |
| Previous Model | None |
| Reference Model | We provide a reference model that includes topography on the Moho, 410 and 650 km discontinuities. The depth of the Moho beneath the Antarctic continent is taken from An et al. (2015) and elsewhere we use the values reported by CRUST1.0 (Laske et al., 2013). The topography on the 410 and 650 km seismic discontinuities are obtained from Kustowski et al. (2008). Wave speeds in this reference model are from CRUST1.0 within the crust and STW105 within the mantle. Note this reference model samples the exact same points as ANT-20. |
| Model Download | Model in netCDF 3 Classic format: ANT-20-voigtVs-0.0.nc (see metadata). Reference model in netCDF 3 Classic format: ANT-20-REF-voigtVs-0.0.nc (see metadata). |
| Model Homepage | |
| Depth Coverage | Included in the netCDF are depths from -4 km to 800 km relative to sea level. The best resolved regions are south of 60 degrees south and between 60 and 650 km depth. |
| Area | The model space includes 1 single chunk of the cubed-sphere (Komatitsch & Tromp, 2002) and represents 1/6 of the Earth. The best resolved regions are south of 60° south. |
| Data Set Description | The adjoint inversion was performed using 270 earthquakes between Mw 5.0 and 6.5 that occurred between 2001 and 2016. Three-component waveforms from these events recorded at 323 broadband seismic stations were used in the inversions. This includes P, S, Rayleigh and Love waves, including reflections and overtones. The final iterations include body waves between 15-50 and 25-150 sec and surface waves between 25-150 sec. See Lloyd et al. (2020) for further details. |

Citations and DOIs
To cite the original work behind this Earth model:
- Lloyd, A. J., Wiens, D. A., Zhu, H., Tromp, J., Nyblade, A. A., Aster, R. C., et al (2019). Seismic structure of the antarctic upper mantle imaged with adjoint tomography. Journal of Geophysical Research: Solid Earth, 124. https://doi.org/10.1029/2019JB017823
To cite IRIS DMC Data Products effort:
- Trabant, C., A. R. Hutko, M. Bahavar, R. Karstens, T. Ahern, and R. Aster (2012), Data Products at the IRIS DMC: Stepping Stones for Research and Other Applications, Seismological Research Letters, 83(5), 846–854, https://doi.org/10.1785/0220120032.
DOI for this EMC webpage: https://doi.org/10.17611/dp/emc.2020.ant20.1
References
- Komatitsch, D., & Tromp, J. (2002). Spectral‐element simulations of global seismic wave propagation—II. Three‐dimensional models, oceans, rotation and self‐gravitation. Geophysical Journal International, 150(1), 303–318. https://doi.org/10.1046/j.1365‐ 246X.2002.01716.x
- Kustowski, B., Ekström, G., & Dziewoński, A. M. (2008). Anisotropic shear‐wave velocity structure of the Earth’s mantle: A global model. Journal of Geophysical Research ‐ Solid Earth, 113. https://doi.org/10.1029/2007JB005169
- Laske, G., Masters, G., Ma, Z., & Pasyanos, M. (2013, April). Update on CRUST1. 0—A 1‐degree global model of Earth’s crust. In Geophys. Res. Abstr, (Vol. 15, p. 2658). Vienna, Austria: EGU General Assembly.
- An, M., Wiens, D. A., Zhao, Y., Feng, M., Nyblade, A. A., Kanao, M., et al. (2015). S‐velocity model and inferred Moho topography beneath the Antarctic plate from Rayleigh waves. Journal of Geophysical Research: Solid Earth, 120, 359–383. doi:10.1002/ 2014JB011332
Credits
- r.0.0 model provided by Andrew J. Lloyd.
Revision History
revision r.0.0: uploaded October 29, 2020.
Timeline
- 2020-10-29
- online


