|
|
Virtual Seismic Networks Frank
Vernon, University of California, San Diego and |
||||
Seismology
is an opportunistic science where many significant results are achieved
by a combination of good planning and hard work coupled with a strong component
of serendipity. Take for example the recent results generated by data recorded
from the deep Mw = 7.6 Fiji and Mw = 8.2 Bolivia earthquakes and associated
aftershocks in 1994. The high quality data recorded by
the permanent IRIS GSN stations was certainly caused by good planning, while
the fortuitous recording by local PASSCAL experiments was by virtue of a
lot of luck.
The GSN and PASSCAL datasets currently provide most of the broadband data used in seismological research, although this situation will be evolving in the future as data from permanent regional and national broadband stations become more widely available. The 1999 deep Mw = 7.1 Russia-China border event, which did not have a co-located PASSCAL experiment, was well recorded by the Kyrgyz Broadband Network (KNET), the Austrian National Seismic Network, and many other regional and national networks. Many of the data for these events were available almost immediately through the Internet. GSN stations routinely send data back to their respective data collection centers in San Diego and Albuquerque using the NRTS and LISS real-time data delivery systems. The GSN currently includes facilities in more than 80 countries. On a national scale, twenty-three IRIS member universities, along with the USGS, operate real-time regional seismic networks in every seismically active region in the United States (http://www.cnss.org). These networks range from the large aperture University of Alaska network (with nearly 300 stations covering all of Alaska including the Aleutian Islands) to the smaller local networks, such as the Montana Regional Seismic Network. The most striking characteristic of the global distribution of seismographic stations is it's incredibly heterogeneous nature. Many agencies from many countries support the complex infrastructure. These different agencies have missions that range from seismic monitoring to detailed hazard assessment at local levels. They are all united, however, by the data they collect. The transmission of real-time data from seismic field stations to a primary data collection center is being done in a variety of ways according to each network's specific mission and based on unique hardware, communication systems, number of stations, and areal coverage requirements. While each individual network may have different missions and use different types of equipment, all network data centers have one thing in common: access to the Internet. With this existing infrastructure, we can now consider the integration of all accessible real-time data.
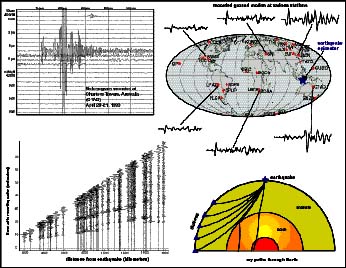
Starting at the end of 1998, we conducted a feasibility test for real-time data integration from multiple disparate seismic networks to create a "Virtual Seismic Network" (VSN). In the test, data from the IRIS GSN network, the PASSCAL Broadband Array, four US regional networks (University of Alaska, UC Berkeley, UC San Diego, and University of Nevada, Reno), and the Kyrgyzstan National Broadband Network were integrated into one common data processing system (Figure 1). This test successfully demonstrated that over 150 seismic stations from seven different primary data collection centers could be accessed through the Internet and processed in real-time. The level of processing accomplished during the test included: data assembly, automated phase picking, event location, and display of event location and magnitude information. In a parallel development, the USGS at Golden has developed their "Virtual Data Logger" as a mechanism to use real-time data from many network data sources to build their global catalog. The VSN is ushering in a new era in seismology where global data are available to any researcher in real-time at nominal cost. But, how will the "real-time" era change seismology? The most immediate impact is that individual researchers will be able to design experiments which will be able to maximize existing resources. For example, if a scientist is interested in operating a portable experiment in Chile, they can construct their own virtual network from the global inventory of stations that maximizes the monitoring capability for that region of interest. Individual researchers can also receive continuous data streams (not event segmented), which means that new discoveries will be made which in the past would have been most likely unexamined (if you don't see it, how can you order it from the DMS?). The following are two examples that show the utility of customized "VSNs": Network 1: Study of the physics of deep focus earthquakes. An experiment could use several broadband regional networks as seismic arrays to form continuous beams on regions were deep earthquakes occur. The network would have the advantage of observing smaller events than the current global catalogs record, provide much finer relative locations between events, and yield significant information about the rupture properties of the larger events. Network 2: Designing a real-time seismicity module for an Earth science course. Students could be allowed to design their own seismic networks using Internet-available stations. The virtual networks could be used, for example, to study a currently active aftershock region. Figure 2 shows a project which presents the record section views of seismograms, showing the source and site locations with a cross-section of the Earth for large teleseisms. This is unquestionably only the beginning. As more scientists obtain access to real-time data streams it is to be expected that entirely new functions will be devised to extract more information from these data in real-time as they design their own Virtual Seismic Networks. Acknowledgments |
|
|