Summary
A 3-D adjoint waveform tomography model for the Middle East and Southwest Asia
Quicklinks
Description
| Name | MESWA |
| Title | A 3-D adjoint waveform tomography model for the Middle East and Southwest Asia |
| Type | 3-D Tomography Earth Model |
| Sub Type | Full waveform model including wavespeed, density and attenuation |
| Year | 2023 |
| Data Revision | r0.1 (revision history) |
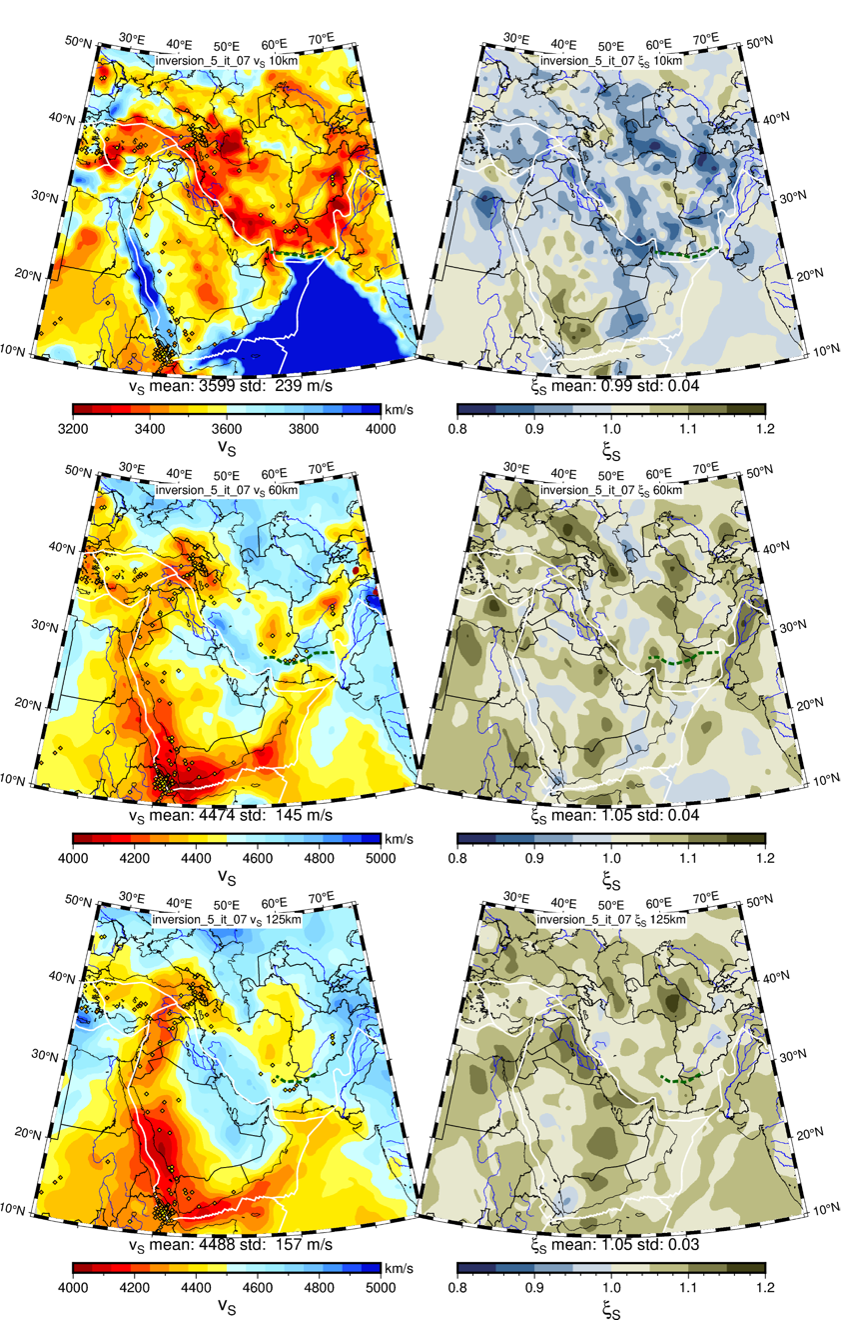
| Short Description | MESWA is a model of radially anisotropic crustal and upper mantle seismic structure of the Middle East and Southwest Asia (MESWA) from adjoint waveform tomography. MESWA provides improved waveform fits in the period band 30-100 seconds relative to the starting and several other models (Rodgers, 2023a). |
| Authors: | Arthur Rodgers: Lawrence Livermore National Laboratory, Livermore, CA, USA. |
| Previous Model | SPiRaL (Simmons et al., 2021) |
| Reference Model | N/A |
| Model Page | None |
| Model Download | MESWA.r0.1.nc is the model in netCDF 3 Classic format with the following parameters and units (see also metadata):
|
| Depth Coverage | 0 to 400 km |
| Area | Middle East and Southwest Asia (10°/50°, 24°/76°) |
| Data Set Description | MESWA is based on inversion of over 35,000 broadband waveforms from 192 earthquakes and openly-available stations to fit to the period band 30-100 seconds (Rodgers, 2023). |

Citations and DOIs
To cite the original work behind this Earth model:
- A. J. Rodgers, L. Krischer, M. Afanasiev, C. Boehm, C. Doodyand N. Simmons (2024). Adjoint Waveform Tomography for Crustal and Upper Mantle Structure of the Middle East and Southwest Asia for Improved Waveform Simulations Using Openly Available Broadband Data. Bull. Seismo. Soc. Am. ; https://doi.org/10.1785/0120230248
- Rodgers, A.J. (2023). Dataset for “MESWA: Seismic structure of the crust and upper mantle of the middle east and southwest asia from adjoint waveform tomography using openly available broadband data”. [Dataset]. Zenodo. https://zenodo.org/record/8212589
To cite IRIS DMC Data Products effort:
- Trabant, C., A. R. Hutko, M. Bahavar, R. Karstens, T. Ahern, and R. Aster (2012), Data Products at the IRIS DMC: Stepping Stones for Research and Other Applications, Seismological Research Letters, 83(5), 846–854, https://doi.org/10.1785/0220120032.
DOI for this EMC webpage: https://doi.org/10.17611/dp/emc.2024.meswa.1
References
Credits
- r0.0 model provided by Arthur Rodgers.
Revision History
r0.0: uploaded August 7, 2023.
r0.1: uploaded March 4, 2024. The revised model (r0.1) corrects an error with the latitude values. The original version (r0.0) provided values on a geocentric coordinate system, while this revision provides the model with regular geographic latitudes. The difference shifts the model northward by at most about 0.2 degree.


