Summary
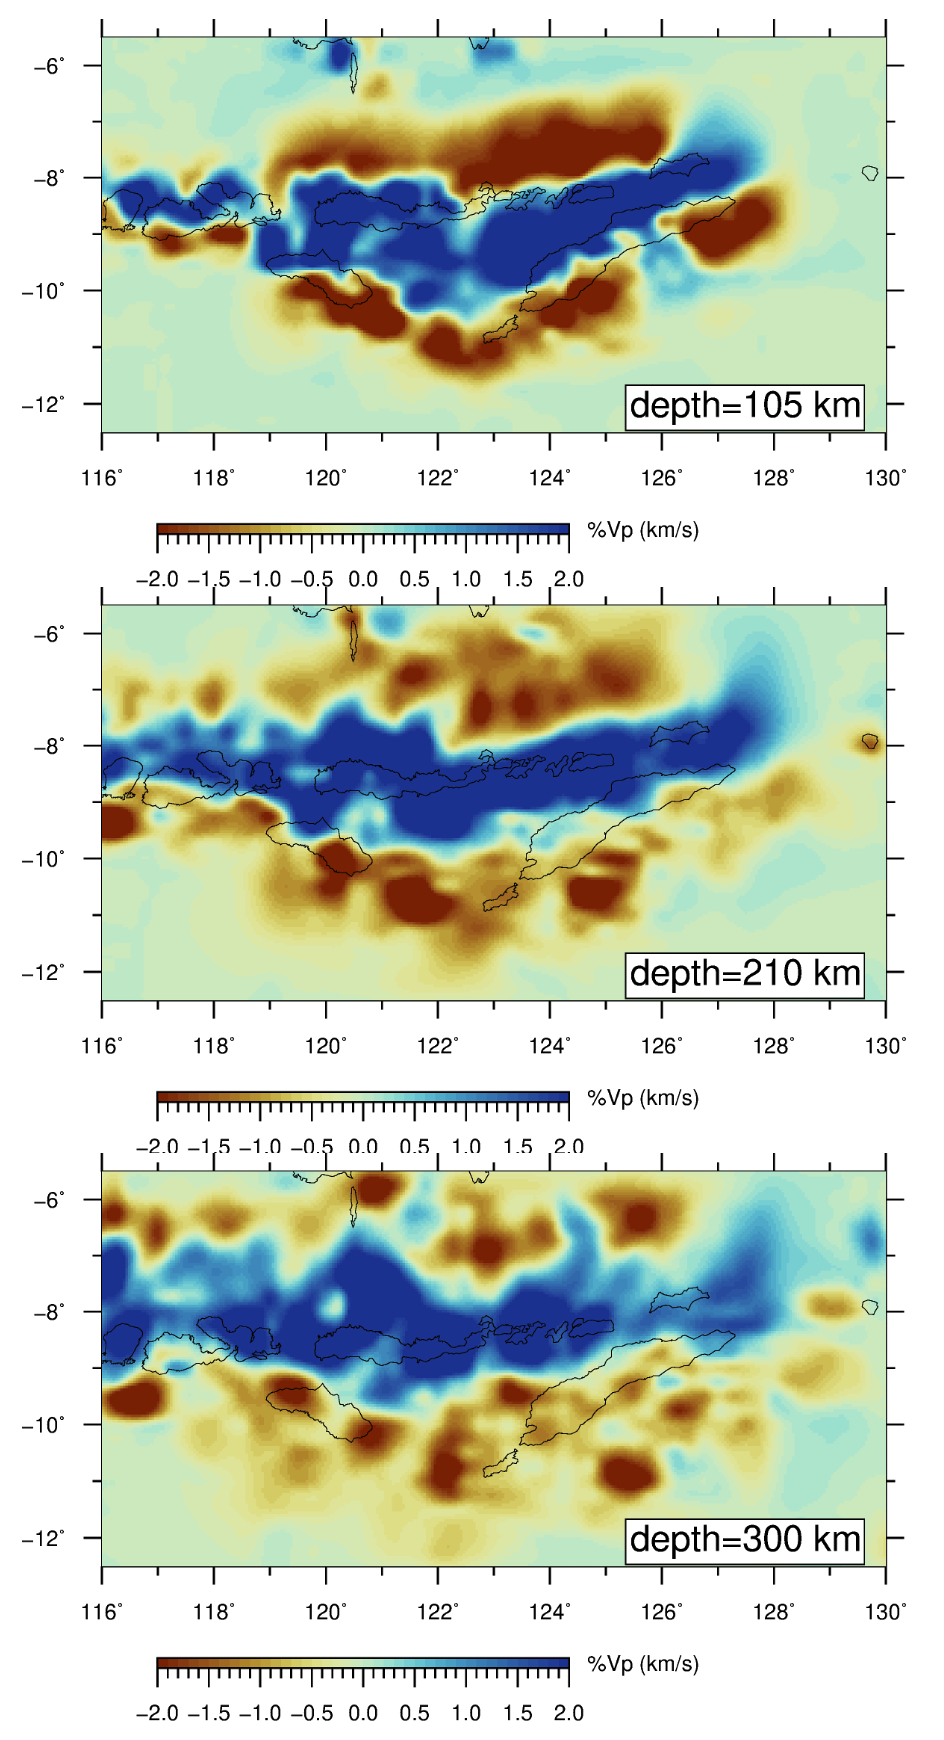
Banda.Pwave.Harris.etal.2020 model incorporates P and PP picks from 90 seismic stations deployed and maintained by multiple networks between 2010 to 2018 including the temporary deployment of 30 broadband stations (YS network).
Quicklinks
Description
| Name | Banda.Pwave.Harris.etal.2020 |
| Title | 3D P-wave velocity model of Eastern Indonesia / Banda Arc mantle from teleseismic tomography |
| Type | 3-D Tomography Earth Model |
| Sub Type | P-wave velocity perturbation (%) |
| Year | 2020 |
| Data Revision | r0.0 (revision history) |
| Short Description | The model incorporates P and PP picks from 90 seismic stations deployed and maintained by multiple networks between 2010 to 2018 including the temporary deployment of 30 broadband stations (YS network). Data from teleseismic earthquakes Mw>5.5 were used to image the P wave velocity structure of the Banda Arc mantle. |
| Authors: | Cooper W. Harris, Department of Earth Sciences, University of Southern California, 3651 Trousdale Pkwy, Los Angeles, CA, 90039 USA Meghan S. Miller, Research School of Earth Sciences, The Australian National University, 142 Mills Rd Canberra, ACT, 2600 Australia Pepen Supendi, Meteorological, Climatological, and Geophysical, Agency (BMKG), Bandung, Indonesia Sri Widiyantoro, Global Geophysics Reseach Group, Institut Teknologi Bandung, Bandung, Indonesia |
| Reference Model | N/A |
| Model Download | Banda.Pwave.Harris.etal.2020.r0.0.nc (see metadata) is the netCDF 3 Classic file for the model. |
| Depth Coverage | 0 km to 525 km (bsl) |
| Area | Eastern Indonesia (latitude: 12.5°S/5.5°S, longitude: 116°E/130E°) |
| Data Set Description | [Harris et al., 2020 ] The dataset includes the multi-frequency compression tomography model – relative P-wave velocity perturbations – for mantle structure beneath Eastern Indonesia. Our data set consists of ~20,000 arrival times of teleseismic P and PP waves recorded across Indonesia. Manually picked P and PP arrival times from 207 events recorded across the YS network of 31 broadband stations (Miller et al., 2016) between 2014 and 2017 for a total of 9,838 traveltime residuals. In addition, 10,117 automatically picked arrivals from 339 events recorded across 59 stations from the AU, IA, and II broadband seismic networks between 2010 and 2018 were incorporated. |

Citations and DOIs
To cite the original work behind this Earth model:
- Harris, C.W., Miller, M.S., Supendi, P., Widiyantoro, S. (2020), Subducted lithospheric boundary tomographically imaged beneath arc-continent collision in eastern Indonesia, Journal of Geophysical Research, 125(8), e2019JB018854, https://doi.org/10.1029/2019JB018854.
- Miller, M. S., O’Driscoll, L. J., Roosmawati, N., Harris, C. W., Porritt, R. W., Widiyantoro, S., et al. (2016). Banda arc experiment—Transitions in the Banda arc-Australian continental collision. Seismological Research Letters, 87(6), 1417– 1423. https://doi.org/10.1785/0220160124
To cite IRIS DMC Data Products effort:
- Trabant, C., A. R. Hutko, M. Bahavar, R. Karstens, T. Ahern, and R. Aster (2012), Data Products at the IRIS DMC: Stepping Stones for Research and Other Applications, Seismological Research Letters, 83(5), 846–854, https://doi.org/10.1785/0220120032.
DOI for this EMC webpage: https://doi.org/10.17611/dp/emc.2021.bandapwave2020.1
Credits
- r0.0 model provided by Meghan Miller.
Revision History
revision r0.0: uploaded August 23, 2021.


