Summary
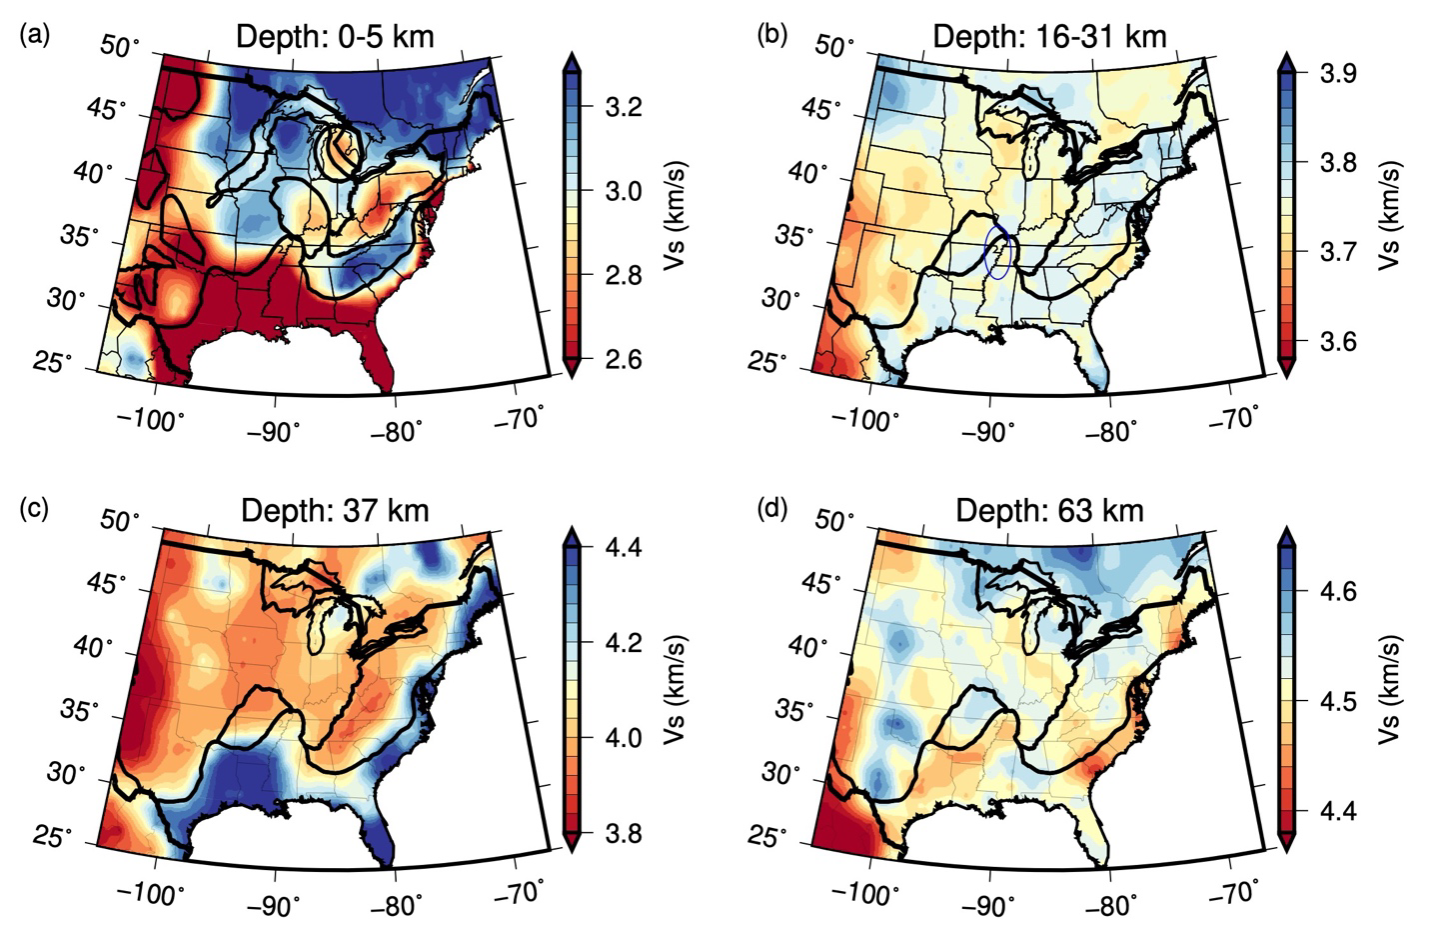
EUS-DGR-2022 (Chai, Ammon, Maceira, and Herrmann, 2022) is a shear velocity model that combines spatially interpolated/smoothed receiver functions, surface-wave dispersions and gravity observations through a 3D simultaneous inversion to image the subsurface S-wave velocity structure of the eastern U.S. region. DGR stands for dispersion, gravity and receiver functions.
Quicklinks
Description
| Name | EUS-DGR-2022 |
| Title | 3D shear-wave velocity model of the Eastern United States |
| Type | 3D Tomography Earth Model |
| Sub Type | Shear-wave velocity (km/s) |
| Year | 2022 |
| Data Revision | r0.0 (revision history) |
| Short Description | The EUS-DGR-2022 shear velocity model combines spatially interpolated/smoothed receiver functions, surface-wave dispersions and gravity observations through a 3D simultaneous inversion to image the subsurface S-wave velocity structure of the eastern U.S. region. Data include 3950 interpolated P-wave receiver functions, 1900 Rayleigh-wave group and phase velocity dispersion curves, and wavenumber filtered Bouguer gravity observations. Constrained by simplified receiver functions and multiple geophysical observations, the velocity model is a reliable starting point for more detailed seismic investigations. Supplements to the original manuscript (available from AGU) include the original-formatted model and related visualizations. |
| Authors: | Chengping Chai, Oak Ridge National Laboratory, Oak Ridge, TN, 37830, USA Charles J. Ammon, Department of Geosciences, Pennsylvania State University, University Park, PA, 16802, USA Monica Maceira, Oak Ridge National Laboratory, Oak Ridge, TN, 37830, USA Robert B. Herrmann, Department of Earth and Atmospheric Sciences, Saint Louis University, St. Louis, MO, 63108, USA |
| Previous Model | None |
| Reference Model | None |
| Model Download | EUS-DGR-2022.r0.0.nc (see metadata) is the EUS-DGR-2022 model in netCDF 3 Classic format. The model is expressed as shear velocity in km/s. Density (g/cm3) and P-wave velocity (in km/s) are also provided, which are inferred based on the empirical relationship between density and shear wave velocity (Maceira and Ammon, 2009) and Vp/Vs ratios from Crust 1.0 (Laske et al., 2013) |
| Model Home Page | None |
| Depth Coverage | 1 to 2048 km |
| Area | Eastern U.S. region (latitude: 25.5˚/49.5˚, longitude: -104.5˚/-67.5˚) |
| Data Set Description | The dataset includes spatially interpolated/smoothed P-wave receiver functions from around 1700 stations, Rayleigh-wave group velocities (short periods from Herrmann et al., 2021 and long periods from Ekström, 2011), and wavenumber filtered Bouguer gravity observations (Balmino et al., 2012). The receiver functions were processed following steps described by Chai et al. (2015). |

Citations and DOIs
To cite the original work behind this Earth model:
- Chai, C., Ammon, C. J., Maceira, M., & Herrmann, R. (2022). Crust and upper mantle structure beneath the eastern United States. Geochemistry, Geophysics, Geosystems, 23(3), e2021GC010233. https://doi.org/
https://doi.org/10.1029/2021GC010233 .
To cite IRIS DMC Data Products effort:
- Trabant, C., A. R. Hutko, M. Bahavar, R. Karstens, T. Ahern, and R. Aster (2012), Data Products at the IRIS DMC: Stepping Stones for Research and Other Applications, Seismological Research Letters, 83(5), 846–854, https://doi.org/10.1785/0220120032.
DOI for this EMC webpage:
https://doi.org/10.17611/dp/emc.eusdgr2022.1
References
- Balmino, G., N. Vales, S. Bonvalot, & A. Briais (2012), Spherical harmonic modelling to ultra-high degree of Bouguer and isostatic anomalies, Journal of Geodesy, 86(7), 499–520, https://doi.org/
https://doi.org/10.1007/s00190-011-0533-4 . - Chai, C., Ammon, C. J., Maceira, M., & Herrmann, R. B. (2015). Inverting interpolated receiver functions with surface wave dispersion and gravity: Application to the western U.S. and adjacent Canada and Mexico. Geophysical Research Letters, 42(11), 4359–4366. https://doi.org/
https://doi.org/10.1002/2015GL063733 - Ekström, G. (2011), A global model of Love and Rayleigh surface wave dispersion and anisotropy, 25–250 s, Geophysical Journal International, 187(3), 1668–1686, https://doi.org/
https://doi.org/10.1111/j.1365-246X.2011.05225.x . - Herrmann, R. B., Ammon, C. J., Benz, H. M., Aziz-Zanjani, A., & Boschelli, J. (2021). Short-period surface-wave tomography in the continental United States—a resource for research. Seismological Research Letters, 92(6), 3642–3656. https://doi.org/
https://doi.org/10.1785/0220200462 . - Laske, G., G. Masters, Z. Ma, & M. Pasyanos (2013), Update on CRUST1.0—A 1-degree global model of Earth’s crust, Abstracts EGU2013-2658 presented at 2013 EGU General Assembly Conference, Vienna, Austria, 7–12 April.
- Maceira, M., & Ammon, C. J. (2009). Joint inversion of surface wave velocity and gravity observations and its application to central Asian basins shear velocity structure. Journal of Geophysical Research, 114(B2), B02314. https://doi.org/
https://doi.org/10.1029/2007JB005157
Credits
- r0.0 model provided by Chengping Chai.
Revision History
revision r0.0: uploaded August 10, 2023.
Timeline
- 2023-08-11
- r0.0 online


